Julia Fukuyama
Reading: R for data science chapters 10 and 12, Cleveland pp. 42–67.
Three main ways to store data
Tibbles are a better version of data frames.
The documentation describes them as “data.frames for the lazy and surly: they do less (i.e. they don’t change variable names or types, and don’t do partial matching) and complain more (e.g. when a variable does not exist).”
Two other advantages:
Base R functions, including those for data frames, try to guess what you want to do.
This sometimes leads to unexpected outcomes, so tibbles have done away with most of that.
Separate:
## function (data, col, into, sep = "[^[:alnum:]]+", remove = TRUE,
## convert = FALSE, extra = "warn", fill = "warn", ...)
## {
## ellipsis::check_dots_used()
## UseMethod("separate")
## }
## <bytecode: 0x7fd471b385c0>
## <environment: namespace:tidyr>
## t
## 1 a b
## 2 a c
## 3 a c d
## Warning: Expected 2 pieces. Additional pieces discarded in 1 rows [3].
## position 1 position 2
## 1 a b
## 2 a c
## 3 a c
## Warning: Expected 3 pieces. Missing pieces filled with `NA` in 2 rows [1, 2].
## position 1 position 2 position 3
## 1 a b <NA>
## 2 a c <NA>
## 3 a c d
Mutate:
## a b
## 1 4 8
## 2 7 8
## 3 3 5
## 4 9 4
## 5 2 10
## 6 1 3
## 7 8 10
## 8 10 7
## 9 5 8
## 10 6 3
## a b sum log_ratio
## 1 4 8 12 -0.6931472
## 2 7 8 15 -0.1335314
## 3 3 5 8 -0.5108256
## 4 9 4 13 0.8109302
## 5 2 10 12 -1.6094379
## 6 1 3 4 -1.0986123
## 7 8 10 18 -0.2231436
## 8 10 7 17 0.3566749
## 9 5 8 13 -0.4700036
## 10 6 3 9 0.6931472
Let’s read in a .csv file on lengths of Billboard Hot 100 songs in 2000:
## Rows: 317 Columns: 83
## ── Column specification ──────────────────────────────────────────────────────────────────────────────────────
## Delimiter: ","
## chr (3): artist.inverted, track, genre
## dbl (66): year, x1st.week, x2nd.week, x3rd.week, x4th.week, x5th.week, x6th...
## lgl (11): x66th.week, x67th.week, x68th.week, x69th.week, x70th.week, x71st...
## date (2): date.entered, date.peaked
## time (1): time
##
## ℹ Use `spec()` to retrieve the full column specification for this data.
## ℹ Specify the column types or set `show_col_types = FALSE` to quiet this message.
billboard_standard = read.csv("https://github.com/hadley/tidy-data/raw/master/data/billboard.csv", stringsAsFactors = FALSE)
billboard_tidy
## # A tibble: 317 × 83
## year artis…¹ track time genre date.ent…² date.pea…³ x1st.…⁴ x2nd.…⁵ x3rd.…⁶
## <dbl> <chr> <chr> <tim> <chr> <date> <date> <dbl> <dbl> <dbl>
## 1 2000 Destin… Inde… 03:38 Rock 2000-09-23 2000-11-18 78 63 49
## 2 2000 Santana Mari… 04:18 Rock 2000-02-12 2000-04-08 15 8 6
## 3 2000 Savage… I Kn… 04:07 Rock 1999-10-23 2000-01-29 71 48 43
## 4 2000 Madonna Music 03:45 Rock 2000-08-12 2000-09-16 41 23 18
## 5 2000 Aguile… Come… 03:38 Rock 2000-08-05 2000-10-14 57 47 45
## 6 2000 Janet Does… 04:17 Rock 2000-06-17 2000-08-26 59 52 43
## 7 2000 Destin… Say … 04:31 Rock 1999-12-25 2000-03-18 83 83 44
## 8 2000 Iglesi… Be W… 03:36 Latin 2000-04-01 2000-06-24 63 45 34
## 9 2000 Sisqo Inco… 03:52 Rock 2000-06-24 2000-08-12 77 66 61
## 10 2000 Lonest… Amaz… 04:25 Coun… 1999-06-05 2000-03-04 81 54 44
## # … with 307 more rows, 73 more variables: x4th.week <dbl>, x5th.week <dbl>,
## # x6th.week <dbl>, x7th.week <dbl>, x8th.week <dbl>, x9th.week <dbl>,
## # x10th.week <dbl>, x11th.week <dbl>, x12th.week <dbl>, x13th.week <dbl>,
## # x14th.week <dbl>, x15th.week <dbl>, x16th.week <dbl>, x17th.week <dbl>,
## # x18th.week <dbl>, x19th.week <dbl>, x20th.week <dbl>, x21st.week <dbl>,
## # x22nd.week <dbl>, x23rd.week <dbl>, x24th.week <dbl>, x25th.week <dbl>,
## # x26th.week <dbl>, x27th.week <dbl>, x28th.week <dbl>, x29th.week <dbl>, …
## year artist.inverted track time genre
## 1 2000 Destiny's Child Independent Women Part I 3:38 Rock
## 2 2000 Santana Maria, Maria 4:18 Rock
## 3 2000 Savage Garden I Knew I Loved You 4:07 Rock
## 4 2000 Madonna Music 3:45 Rock
## 5 2000 Aguilera, Christina Come On Over Baby (All I Want Is You) 3:38 Rock
## 6 2000 Janet Doesn't Really Matter 4:17 Rock
## 7 2000 Destiny's Child Say My Name 4:31 Rock
## 8 2000 Iglesias, Enrique Be With You 3:36 Latin
## 9 2000 Sisqo Incomplete 3:52 Rock
## 10 2000 Lonestar Amazed 4:25 Country
## date.entered date.peaked x1st.week
## 1 2000-09-23 2000-11-18 78
## 2 2000-02-12 2000-04-08 15
## 3 1999-10-23 2000-01-29 71
## 4 2000-08-12 2000-09-16 41
## 5 2000-08-05 2000-10-14 57
## 6 2000-06-17 2000-08-26 59
## 7 1999-12-25 2000-03-18 83
## 8 2000-04-01 2000-06-24 63
## 9 2000-06-24 2000-08-12 77
## 10 1999-06-05 2000-03-04 81
## Min. 1st Qu. Median Mean 3rd Qu. Max.
## "1999-06-05" "2000-02-05" "2000-04-29" "2000-05-03" "2000-08-12" "2000-12-30"
## Length Class Mode
## 317 character character
How long were the songs on the 2000 Hot 100? The display shows that
time
is formatted as time. This seems great, but
unfortunately there’s been a mistake:
We’ll have to go back and fix this: we can specify the type for a certain column by using the col_types argument. We’ll read the times in as characters and parse them ourselves.
billboard_tidy = read_csv("https://github.com/hadley/tidy-data/raw/master/data/billboard.csv",
col_types = cols(time = col_character()))
I’ll show you how to do this two ways, with and without pipes (the
%>%
function in the magrittr
package).
First let’s try without pipes.
We need to separate the time into minutes and seconds. For this we can use separate:
billboard_min_sec = separate(billboard_tidy, time,
into = c("minutes", "seconds"), sep = ":", remove = FALSE)
We can look the columns we have created, plus the original column, to make sure the operation was performed correctly. To look at just a couple of columns, we can use select:
## # A tibble: 317 × 3
## time minutes seconds
## <chr> <chr> <chr>
## 1 3:38 3 38
## 2 4:18 4 18
## 3 4:07 4 07
## 4 3:45 3 45
## 5 3:38 3 38
## 6 4:17 4 17
## 7 4:31 4 31
## 8 3:36 3 36
## 9 3:52 3 52
## 10 4:25 4 25
## # … with 307 more rows
Then we need to add minutes and seconds together to get time in minutes. For this we can use mutate:
billboard_time_in_sec = mutate(billboard_min_sec,
time_in_seconds = as.numeric(minutes) * 60 + as.numeric(seconds))
Again, let’s look at the tibble to make sure the operation was done right:
## # A tibble: 317 × 4
## time minutes seconds time_in_seconds
## <chr> <chr> <chr> <dbl>
## 1 3:38 3 38 218
## 2 4:18 4 18 258
## 3 4:07 4 07 247
## 4 3:45 3 45 225
## 5 3:38 3 38 218
## 6 4:17 4 17 257
## 7 4:31 4 31 271
## 8 3:36 3 36 216
## 9 3:52 3 52 232
## 10 4:25 4 25 265
## # … with 307 more rows
Let’s see how this changes the code we used above.
Remember that we had
billboard_min_sec = separate(billboard_tidy, time,
into = c("minutes", "seconds"), sep = ":", remove = FALSE)
billboard_time_in_sec = mutate(billboard_min_sec,
time_in_seconds = as.numeric(minutes) * 60 + as.numeric(seconds))
Or equivalently, without making an intermediate tibble:
Now that we have our dataset in a nice format, let’s try looking at the distribution of song lengths:
ggplot(billboard, aes(x = time_in_seconds / 60)) +
geom_histogram(breaks = seq(2.5, 8, by = .2)) +
xlab("Time in Minutes")
ggplot(billboard, aes(x = time_in_seconds / 60)) + stat_ecdf() +
scale_x_continuous(breaks = seq(2.5, 8, by = .5)) +
scale_y_continuous(breaks = seq(0, 1, by = .1)) + xlab("Time in Minutes")
The majority of Hot 100 songs (about three quarters) are between 3:15 and 4:30.
But maybe we’re unfairly penalizing songs that are on the charts for a long time: they’re only represented once in our histogram even though they are in the top 100 for multiple weeks.
If we want to investigate this, we need to make one row in our tibble for each week:
billboard_long = billboard %>% pivot_longer(x1st.week:x76th.week, names_to = "week", values_to = "rank", values_drop_na = TRUE)
billboard_long
## # A tibble: 5,307 × 12
## year artis…¹ track time minutes seconds genre date.ent…² date.pea…³ time_…⁴
## <dbl> <chr> <chr> <chr> <chr> <chr> <chr> <date> <date> <dbl>
## 1 2000 Destin… Inde… 3:38 3 38 Rock 2000-09-23 2000-11-18 218
## 2 2000 Destin… Inde… 3:38 3 38 Rock 2000-09-23 2000-11-18 218
## 3 2000 Destin… Inde… 3:38 3 38 Rock 2000-09-23 2000-11-18 218
## 4 2000 Destin… Inde… 3:38 3 38 Rock 2000-09-23 2000-11-18 218
## 5 2000 Destin… Inde… 3:38 3 38 Rock 2000-09-23 2000-11-18 218
## 6 2000 Destin… Inde… 3:38 3 38 Rock 2000-09-23 2000-11-18 218
## 7 2000 Destin… Inde… 3:38 3 38 Rock 2000-09-23 2000-11-18 218
## 8 2000 Destin… Inde… 3:38 3 38 Rock 2000-09-23 2000-11-18 218
## 9 2000 Destin… Inde… 3:38 3 38 Rock 2000-09-23 2000-11-18 218
## 10 2000 Destin… Inde… 3:38 3 38 Rock 2000-09-23 2000-11-18 218
## # … with 5,297 more rows, 2 more variables: week <chr>, rank <dbl>, and
## # abbreviated variable names ¹artist.inverted, ²date.entered, ³date.peaked,
## # ⁴time_in_seconds
The \(y\)-axis scale has changed (since there are more observations.) However, the shape of the distributions are pretty much the same, suggesting that weighting by number of weeks on the chart doesn’t make much difference.
Another question we might be interested in is whether the length of
the songs changes with rank. As a first stab at this, we can facet by
chart position. To avoid drawing 100 graphs, we use
subset()
to only consider the top 10 chart positions:
top10 = billboard_long %>%
subset(rank <= 10)
ggplot(top10, aes(x = time_in_seconds / 60)) +
geom_density() + geom_rug() +
facet_wrap(~ rank, ncol = 4) + xlab("Time in minutes")
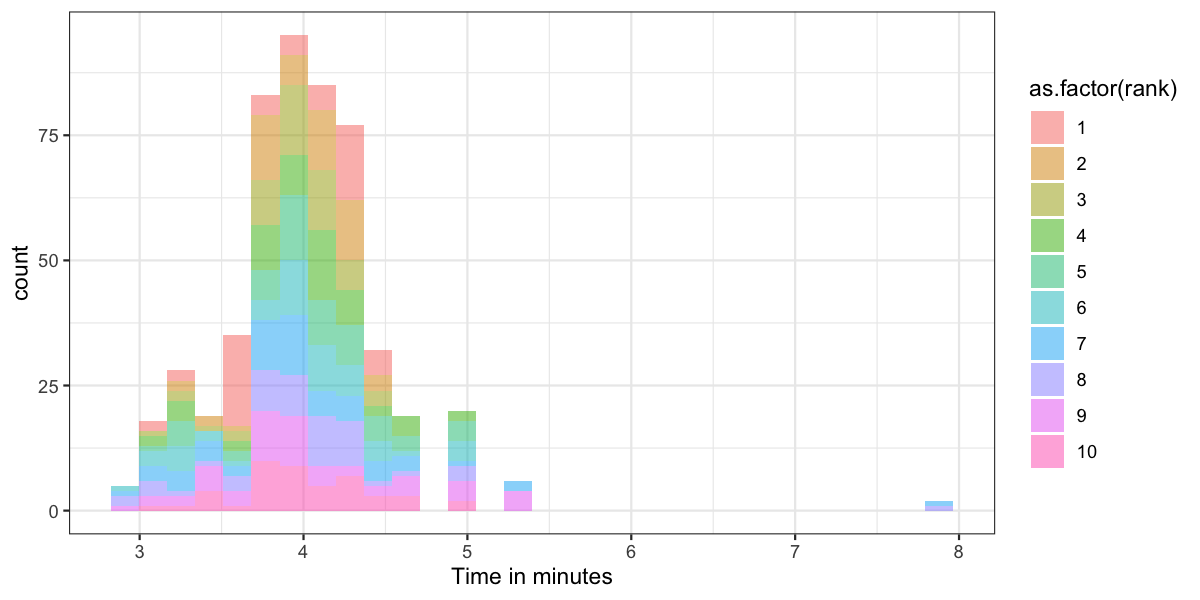
ggplot(top10, aes(x = time_in_seconds / 60, fill = as.factor(rank))) +
geom_density(alpha = .5) + geom_rug() +
xlab("Time in minutes")
ggplot(top10, aes(x = time_in_seconds / 60)) +
geom_histogram() +
facet_wrap(~ rank, ncol = 4) + xlab("Time in minutes")
## `stat_bin()` using `bins = 30`. Pick better value with `binwidth`.
ggplot(top10, aes(x = time_in_seconds / 60, fill = as.factor(rank))) +
geom_histogram(alpha = .5) +
xlab("Time in minutes")
## `stat_bin()` using `bins = 30`. Pick better value with `binwidth`.
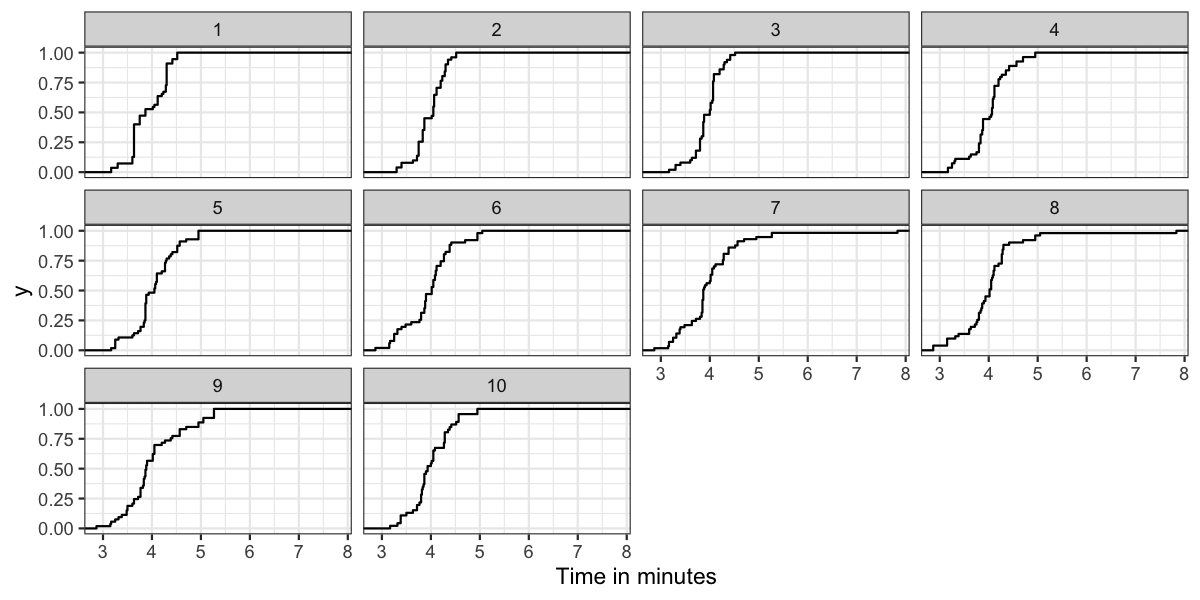
ggplot(top10, aes(x = time_in_seconds / 60)) +
stat_ecdf() + facet_wrap(~ rank) + xlab("Time in minutes")
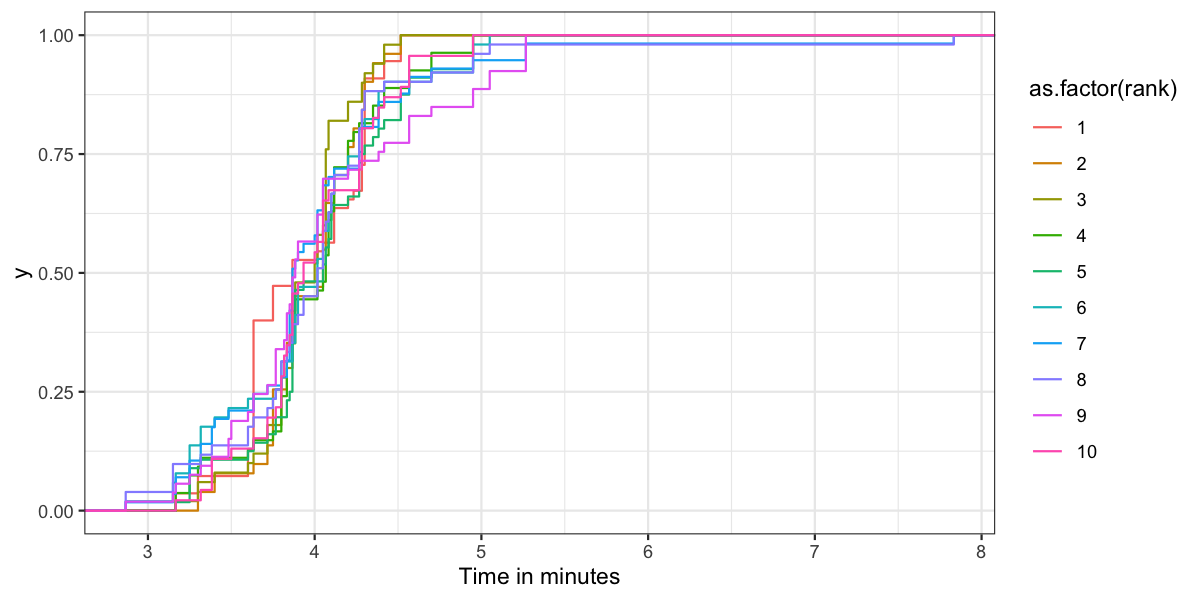
ggplot(top10, aes(x = time_in_seconds / 60)) +
stat_ecdf(aes(color = as.factor(rank))) + xlab("Time in minutes")
Which plot do you think makes it the easiest to compare the distributions?
Finally, let’s find mean song length by chart position.
This will allow us to compare all 100 chart positions instead of just the first 10.
mean_times = billboard_long %>%
group_by(rank) %>%
summarise(avg_time_in_minutes = mean(time_in_seconds) / 60)
## remember this is the same as
mean_times_alt = summarise(group_by(billboard_long, rank),
avg_time_in_minutes = mean(time_in_seconds) / 60)
ggplot(mean_times, aes(x = rank, y = avg_time_in_minutes)) +
geom_point() + ylab("Average time in minutes")
There is enough noise here that it’s hard to see if there’s a relationship between rank and song length. Later on we’ll learn a bit about smoothing, which would help a lot here.
Reading: Cleveland pp. 42–67.
In an intro course like S320/520, you learned to use the most common transformation, the log.
The log transformation doesn’t always work – for a start, you can’t log zero or a negative number.
Power transformations allow a wider range of options.
Define a power transformation with parameter \(\tau\) to be \(x^\tau\).
Where practical, we’ll hugely prefer \(\tau = 1\) (no transformation), \(\tau = 0\), or possibly \(\tau = -1\) (inverse transformation) because they’re much easier to interpret.
You might also see Box-Cox transformations: these are really just power transformations, but re-scaled so that they go continuously to the log transform as \(\tau \to 0\) on either side.
Let \(x\) be the original data value, and let \(f_\tau\) be the Box-Cox transformation with parameter \(\tau\). It is defined as:
\[ f_\tau(x) = \begin{cases} \frac{x^{\tau} - 1}{\tau} & \tau \ne 0\\ \log x & \tau = 0 \end{cases} \]
Here’s a little picture of the transformations, note how the log transformation floats nicely in between the negative and positive values of \(\tau\).
x = seq(0, 5, length.out = 100)[-1]
bc_trans = function(x, tau) {
if(tau == 0){
return(log(x))
}
return((x^tau - 1) / tau)
}
tau_vec = seq(-.4, 1.4, by = .2)
transforms = sapply(tau_vec, function(tau) bc_trans(x, tau))
transforms_melted = melt(transforms)
transforms_for_plotting = transforms_melted %>% mutate(x = x[Var1], tau = tau_vec[Var2])
ggplot(transforms_for_plotting) +
geom_line(aes(x = x, y = value, color = as.factor(tau))) +
xlab("Original Data Value") + ylab("Transformed Value")
Load ggplot2
:
We’ll also use an R workspace prepared by Cleveland to use in conjunction with the book. Among other things, this contains the data sets used in the book.
We’ll use the stereogram fusion time data in
fusion.time
, which contains the group variable
nv.vv
(where “NV” means no visual information and “VV”
means visual information) and the quantitative variable
time
(a positive number.)
Let’s try some of the power transformations on the fusion time data — we would like to see which gives a distribution closest to normal. (Why?)
We’ll just look at the VV times for now.
vv = fusion.time %>% subset(nv.vv == "VV")
tau_vec = seq(-1, 1, by = .25)
transforms = sapply(tau_vec, function(tau) bc_trans(vv$time, tau))
transforms_melted = melt(transforms)
transforms_for_plotting = transforms_melted %>% mutate(tau = tau_vec[Var2])
ggplot(transforms_for_plotting) +
stat_qq(aes(sample = value)) +
facet_wrap(~ tau, scales = "free", ncol = 5)
Here \(\tau\)-values of \(0\) (the log transformation) and \(-0.25\) give the straightest Q-normal plots.
Since it’s much, much easier to interpret \(\log(x)\) than \(x^{-0.25}\), we strongly prefer the log transformation.
In your more theoretical statistics courses, you might come across variance-stabilizing transformations.
In real data, we often see that the variance depends on the mean.
For example, if \(X\) is distributed \(\text{Poisson}(\lambda)\), \(E_\lambda(X) = \lambda\), and \(\text{Var}_\lambda(X) = \lambda\).
For Poisson random variables, the square root transformation (\(\tau = 1/2\)) is approximately variance stabilizing, that is, \(X^{1/2}\) will have variance that is about the same no matter what \(\lambda\) is.
Conut data often have a Poisson distribution, and so it is often useful to use a square root transformation for counts.
The re-expressions most frequently useful for counts are logs and (square) roots. In fact, it is rather hard to find a set of counts that are better analyzed as raw counts than as root counts.
Tukey, EDA, p. 83-84
If we have random variables \(X_i\), with \(E(X_i) = \mu\) and \(\text{Var}(X_i) = s^2 \mu^2\) (the standard deviation is proportional to the mean), then the log transformation (\(\tau = 0\)) is approximately variance stabilizing.
Putting everything together to build simple models.