The gif above cycles through projections of data taken from an antibiotic time course study[1] included in the adaptiveGPCA
package.
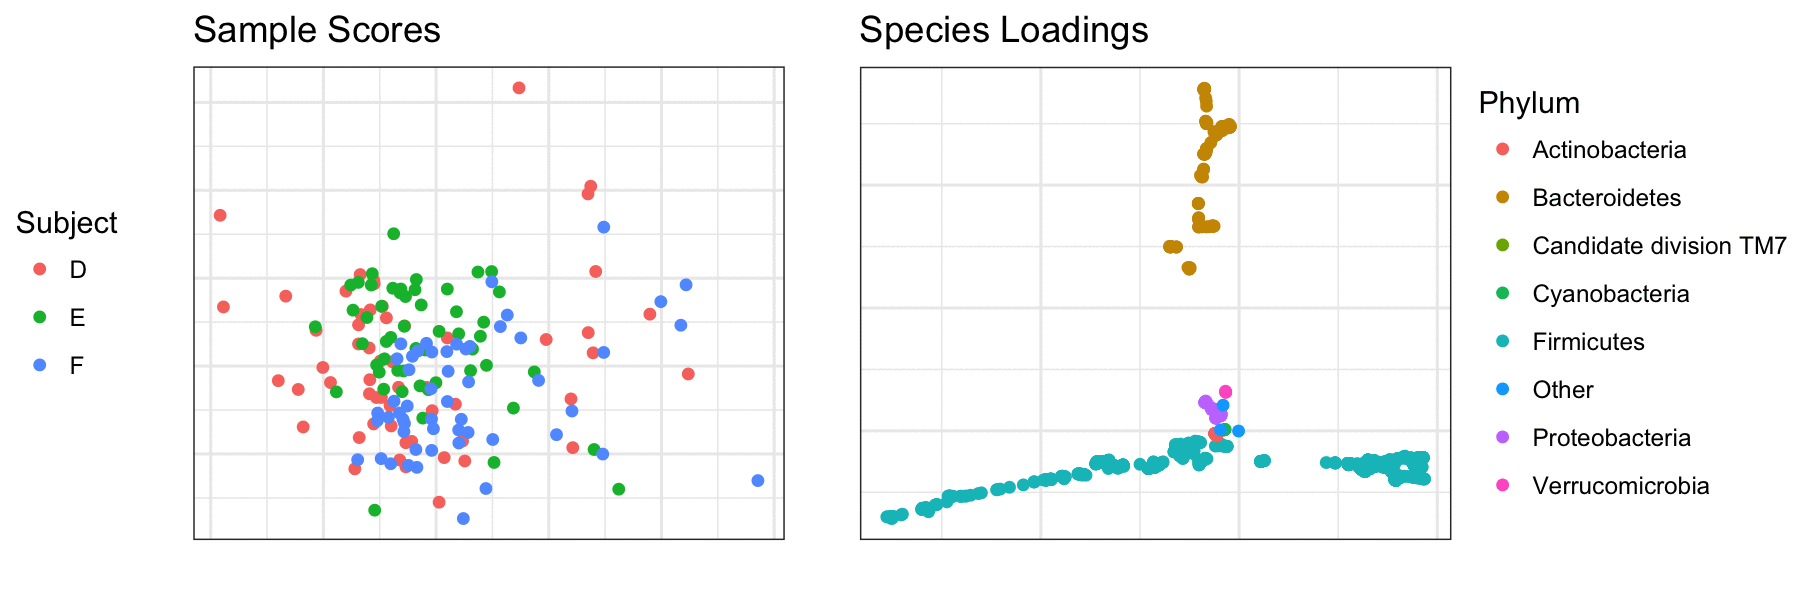
The data is a samples by species matrix, and we can visualize it using a sequence of projections.
The panel on the left shows the projections of the samples onto a generalized PCA plane, and the panel on the right shows the loadings on the species on the respective generalized PCA plane.
At one end of the spectrum, the loadings of the species on the principal plane are very constrained by the phylogenetic relationships between the species, and at the other end of the spectrum the loadings of the variables are completely unconstrained by the phylogeny.
[1]Dethlefsen, L., and D. A. Relman. “Incomplete recovery and individualized responses of the human distal gut microbiota to repeated antibiotic perturbation.” Proc Natl Acad Sci USA 108. Suppl 1 (2010): 4554-4561.
